
So we are offered internships in star companies in Sri Lanka and I was chosen to one of them. We’re supposed to take these experiences from the internship when we step into the industry for the stake of industry measures and our performance measures. This training is not just for strengthening our technical skills but also for enhancing our personalities, domain expertise, production environments and to take a know-how about customer interactions. This is basically offered to make us ready to welcome the industry norms and its standards.
In these internships, we are given tasks on the particular domain which the company which we are doing our internship in. In my case, it’s software platforms for stock brokerages. They offer PaaS (Platform as a Service) solutions for the stock brokers. Stock Brokers are people (professional bodies) who buys and sells stocks to different clients (retail and institutional) through a stock-exchange. They demand a fee based on the stocks they are concerned with.
My first task here is to develop an analysis solution for server logs for a server which does monitoring of all the order management systems. I’m not in a position of explaining the core architectures and libraries that are involved inside the system and how each of them are connected, as those aspects are company properties. But I decided to write about what I learn along the way of internship – as a general outline. Thus, these series of blog posts would not involve any of the copyright protected materials – I will just be going through the free utilities and tools I learn along the way including their general use cases. So that it will help another developer to get kick starts on these areas. These days, technologies come in stacks (In bundles) so it is pretty intimidating to find where to start. I myself am going through the same tunnel and that is one major reason to give insights on stuff which I learn.
ELK Stack for indexing and analysis of data
ELK is an abbreviation of Elasticsearch Logstash and Kibana. This is called a stack because of a reason – they usually work together in production level environments.
- Elasticsearch – This is a NoSQL database of documents. Documents in JSON form are indexed and stored in elasticsearch for rapid searches. It is also called a Document oriented search engine. Elasticsearch is built on top of Apache Lucene which embeds fast, and powerful search algorithms including a ranked search. Here, indexing is a tokenization of the document and storing it such that it is easy to search for. Elasticsearch performs parallel execution of search queries in different nodes. Each node resides inside a cluster of nodes and each cluster and a node has unique names and IDs to be identified. There is also a concept called a shard which splits the indices across multiple nodes in the cluster which allows parallel search executions so that the search is made much faster. Replicas of nodes are made to withstand tolerance levels when it comes to node failures. By default, there are five shards per an index and one replica per shard. The important fact about elasticsearch is that it is Schema-less. Thus data is not enforced to be of a particular schema (Unlike a MySQL table) – you are free to include JSONs without adhering to a strict paradigm of schema. This, in fact, can be regarded as a broad advantage of using document-oriented databases in contrast to relational databases.
- Logstash – Logstash is a data parsing tool – usually it parses logs. It can identify patterns (through Regular Expressions) and modify data according to our needs.
- Kibana – This is a data-visualization tool. It visualizes data which are indexed inside the Elasticsearch database.
The Usual workflow of the ELK stack
Typically, understanding something is done far better when it comes to understanding that particular notion in its flow. ELK stack is used inside a flow of events. Here in this section, I will brief you about the workflow of the stack for the purpose of my task – analyzing and visualizing data.
Before diving into the stack itself, we might as well understand the concepts behind the Beats toolkit which Elastic provides.
Beats is a data shipping tool for elasticsearch. They usually stay in hosts and servers and feed data into elasticsearch – think of them as those housewives who gossip the data to each other. There are plenty of tools included in this toolkit – most important ones for my task are Metricbeats and Filebeats. What Metricbeats does is it feeds system metrics to elasticsearch (Or Logstash) – including CPU usage, network usage, I/O operation counts etc. Filebeats ships log data to elasticsearch (Or Logstash). Notice how I’ve included “Or Logstash” in each of the sentences. That is primarily because, raw data which we accumulate from hosts and servers are not usually sent to Elasticsearch as a whole. They are parsed and made useful for our concerns. Logstash has powerful parses like Grok for these kinds of circumstances. Grok has some nicely implemented pattern matching tools which deal with Regexes. This is like those housewives telling one story to one person and that person (In this case, Logstash) tells a slightly disoriented (maybe firm) version of the same story, filtering (in this case, adjusting) information to her own needs, to another person. Filters, in Logstash, can structure, transform and normalize data using several plugins like Grok patterns. These are also called Mutate Filters. Mutate is a word that we all have heard of, you also are a Java programmer. Java has this concept of Encapsulation, which we encapsulate data (fields) inside the class itself and provide accessors (getters) and mutators (setters) to access the fields. Beats inputs usually goes through a Queue so that it would not block the I/O operations.
Setting up and running a stdout in Logstash + Filebeats
Setting up a local instance for Logstash and Filebeats is pretty easy and nicely described in the official documentation. If you’re in Windows, you just have to download and extract the folders into a directory of your choice. If you’re in Linux, you can obtain the DEB file and use sudo dpkg -i filename.deb and install it.
You do not have to configure anything in Logstash but you do need to give the pipeline of the data input, filter and the output through a .conf file.

The content inside is pretty self explanatory – input is configured to use the beats plugin because we input our data from Beats (Filebeats) library. In my case, they are log files.
Notice that I have used a codec => rubydebug codec to display the data. This is how you style console data. Hopefully, you know that stdout is a default system call to display something in the console. I put this file in the bin directory inside the extracted path of Logstash.
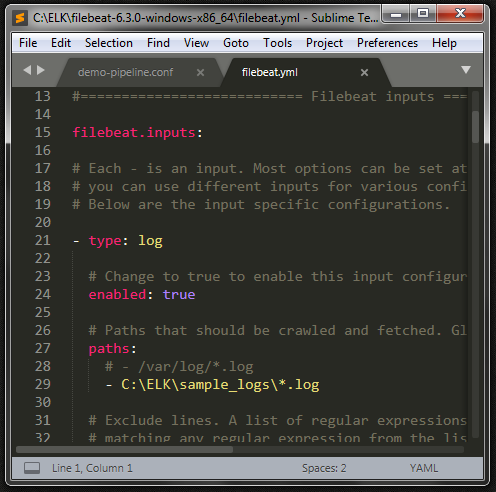
Now let us configure Filebeats. Download, extract filebeat and open filebeat.yml. DO NOT USE filebeat.reference.yml. That is for a reference – I spent at least an hour changing this and hoping something would come up. Don’t do that mistake.

Now run logstash using logstash.bat -f demo-pipeline.conf (In bin directory of logstash) and after it is finished spinning up, open another terminal (cmd) and start filebeats using filebeats.exe (In filebeat extracted directory.
You should see the logs as a JSON (obviously in the console you run Logstash) including some metadata which are appended by Logstash.
Intern Diaries #2 will be focused on extracting data from Logstash.
